

Getting Started
Getting Started
RitchViewer Help - Getting Started
If in doubt, ask.
At RitchViewer© we want you to recommend us to your colleagues, peers and friends.
So don’t hold back. Ask us your questions:
- How does this software work?
- Why isn’t my spreadsheet working?
- I’d really like to see this feature added (go to wishlist@RitchViewer.com)
We provide support for our customers by e-mail with a response time of one business day. If you have any questions, please ask here: TechnicalSupport@RitchViewer.com
Here are some Help Samples from the RitchViewer© Excel Menu
One of the best places to start is to look at the sample workbooks that came with your install. On the RitchViewer© menu in Microsoft Excel, choose the ‘Help Samples’ icon. The first workbook you should look at is ‘RitchViewerIntro.xls’.
Where Does RitchViewer get its data from?
If you want to understand what data is driving RitchViewer, then:

favourites
favourites
Favourites
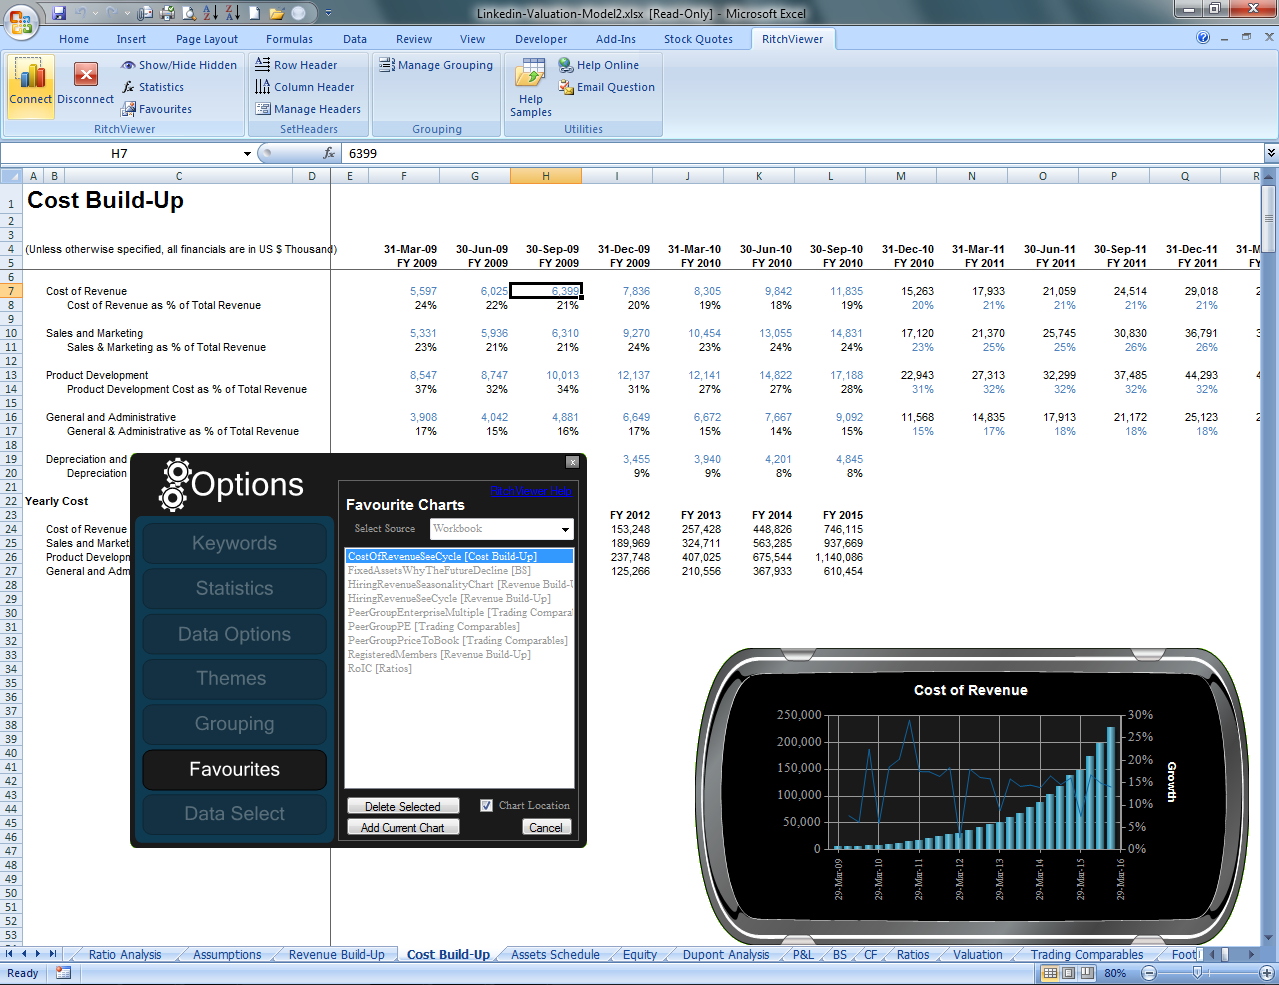
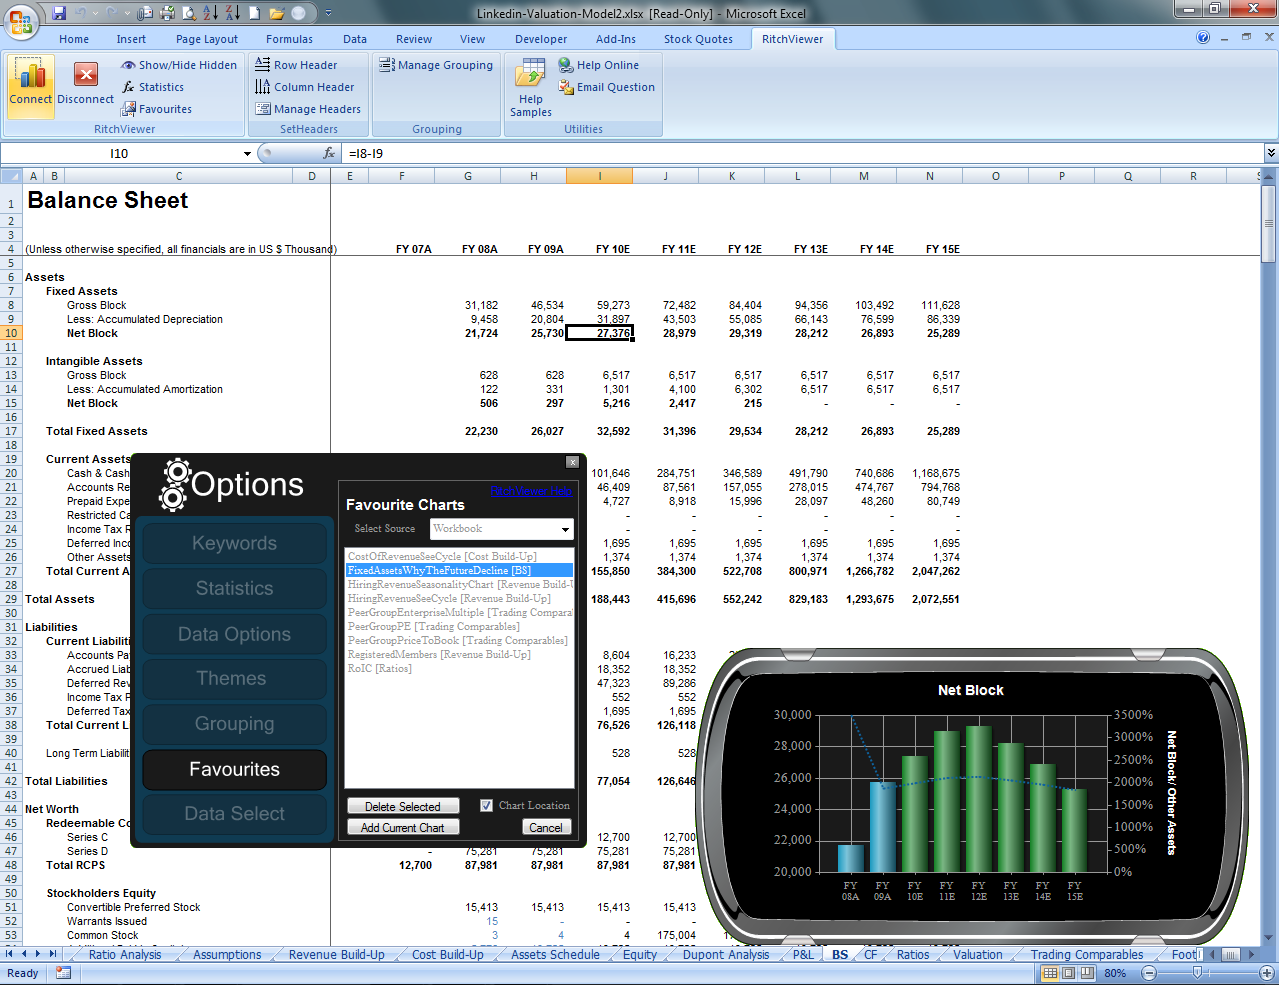
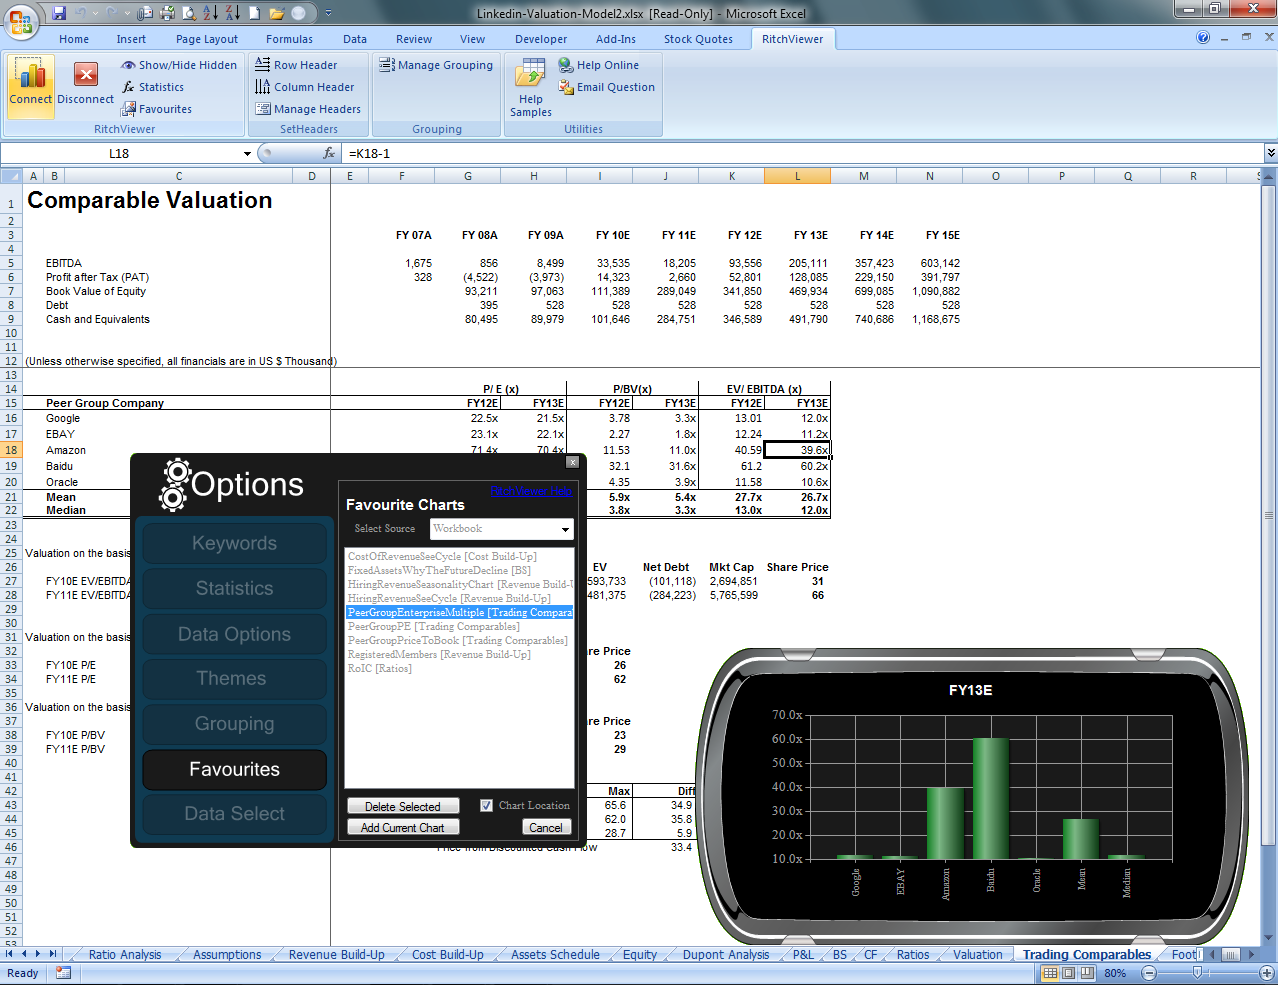
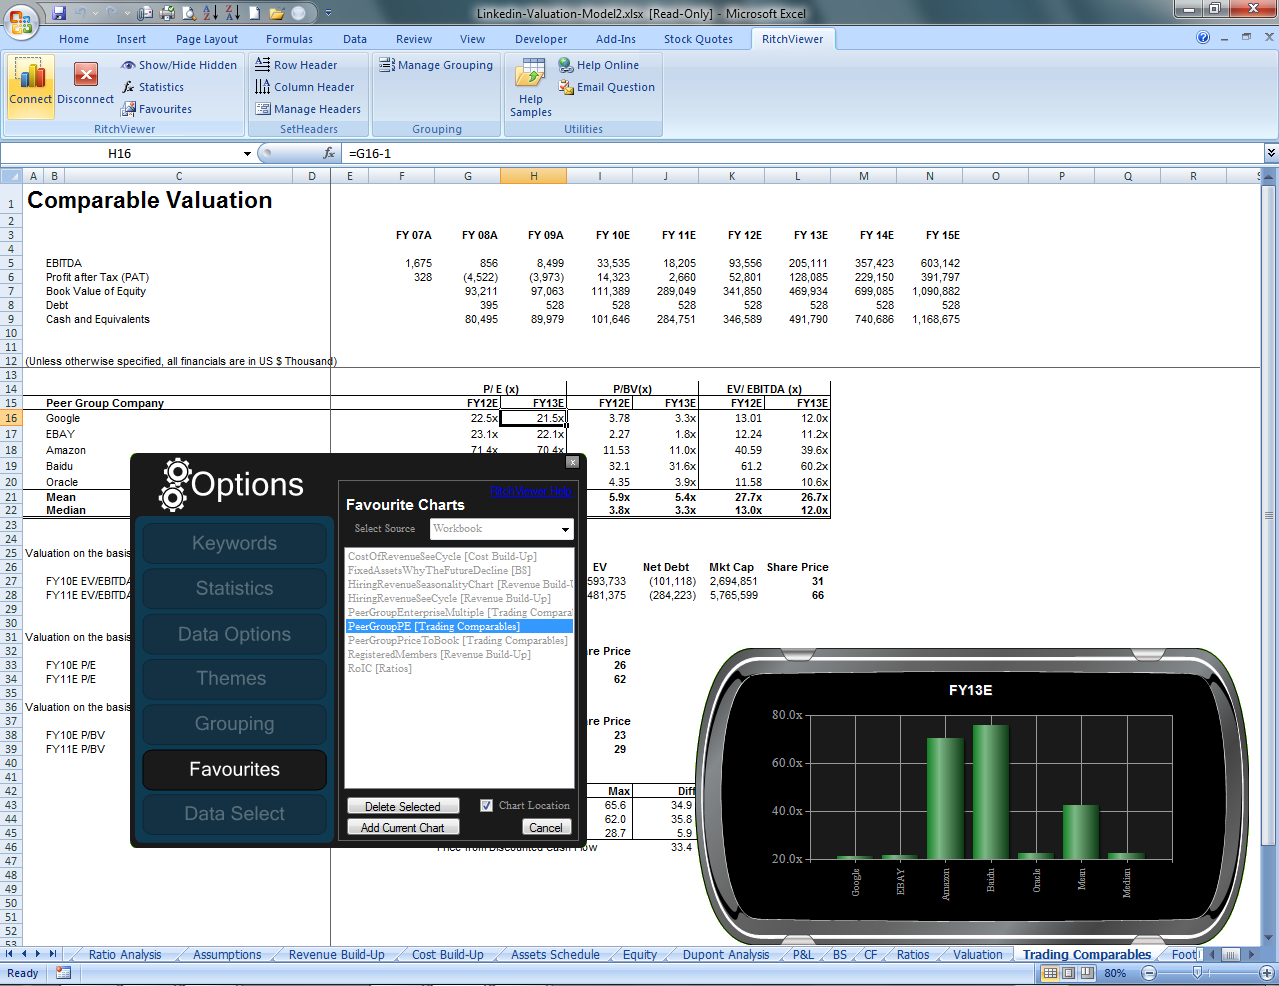
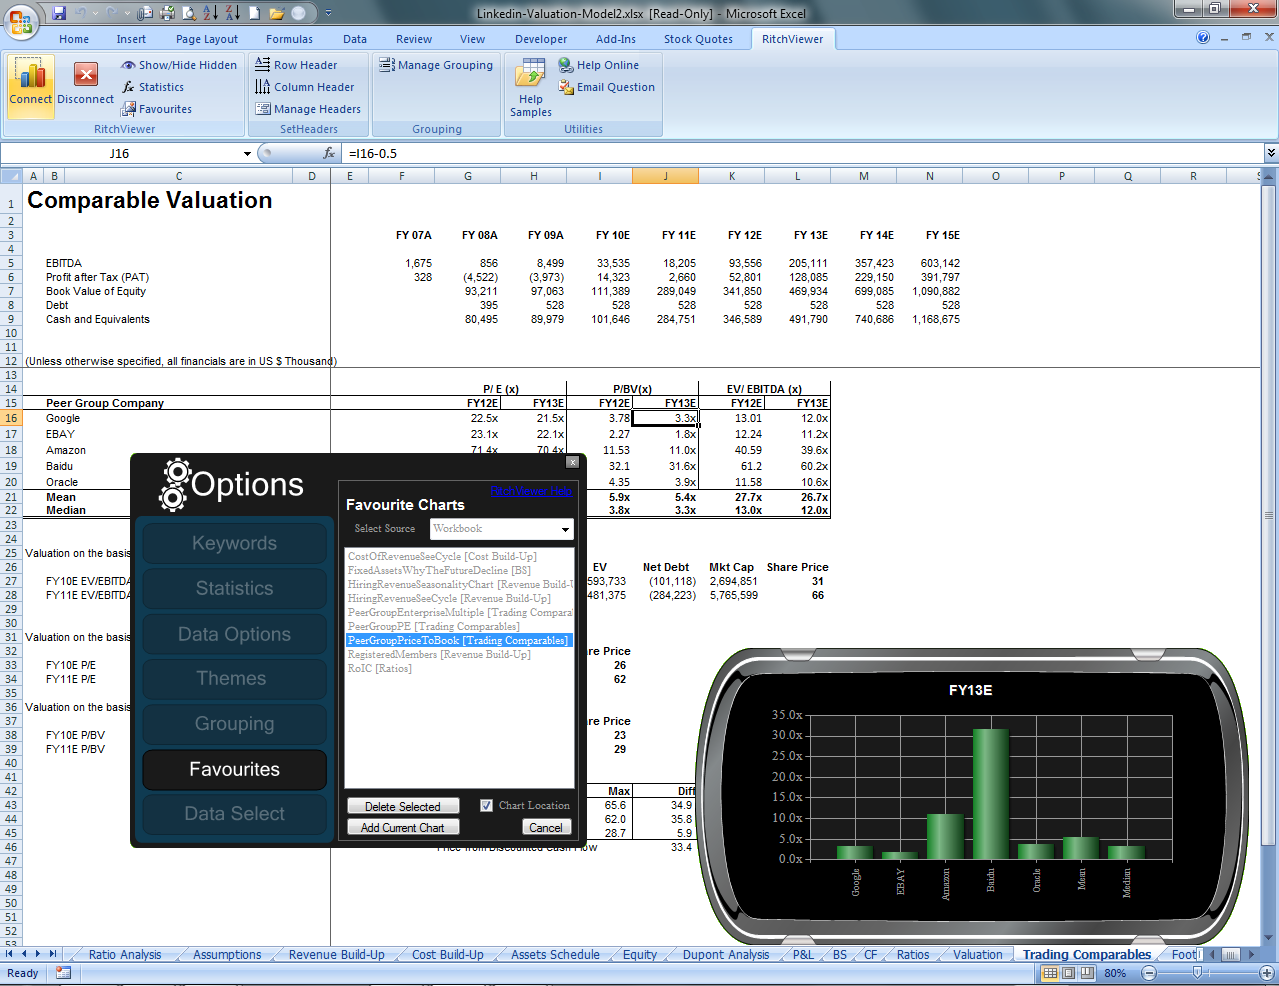
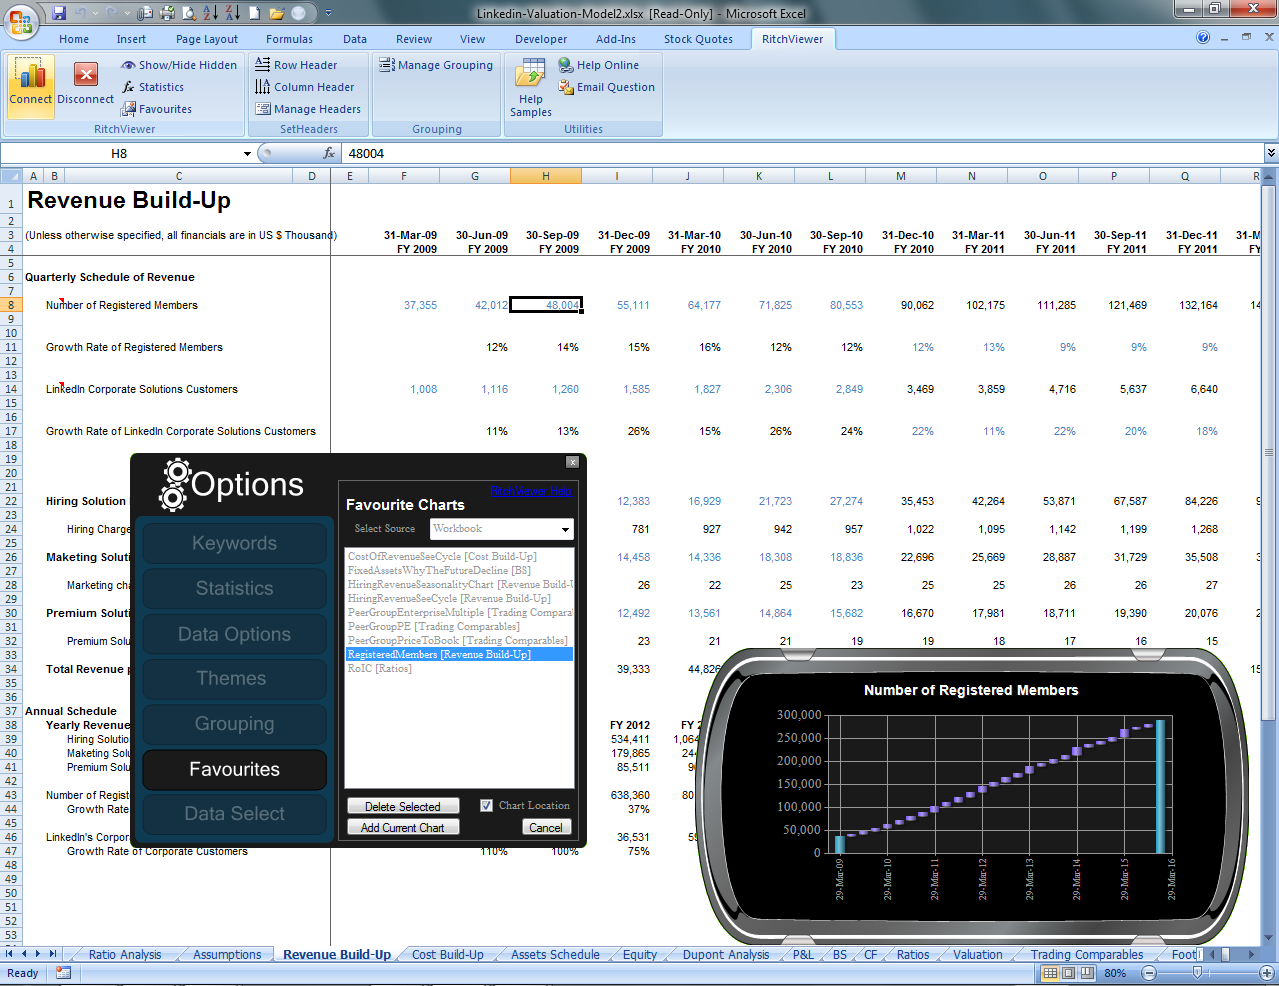
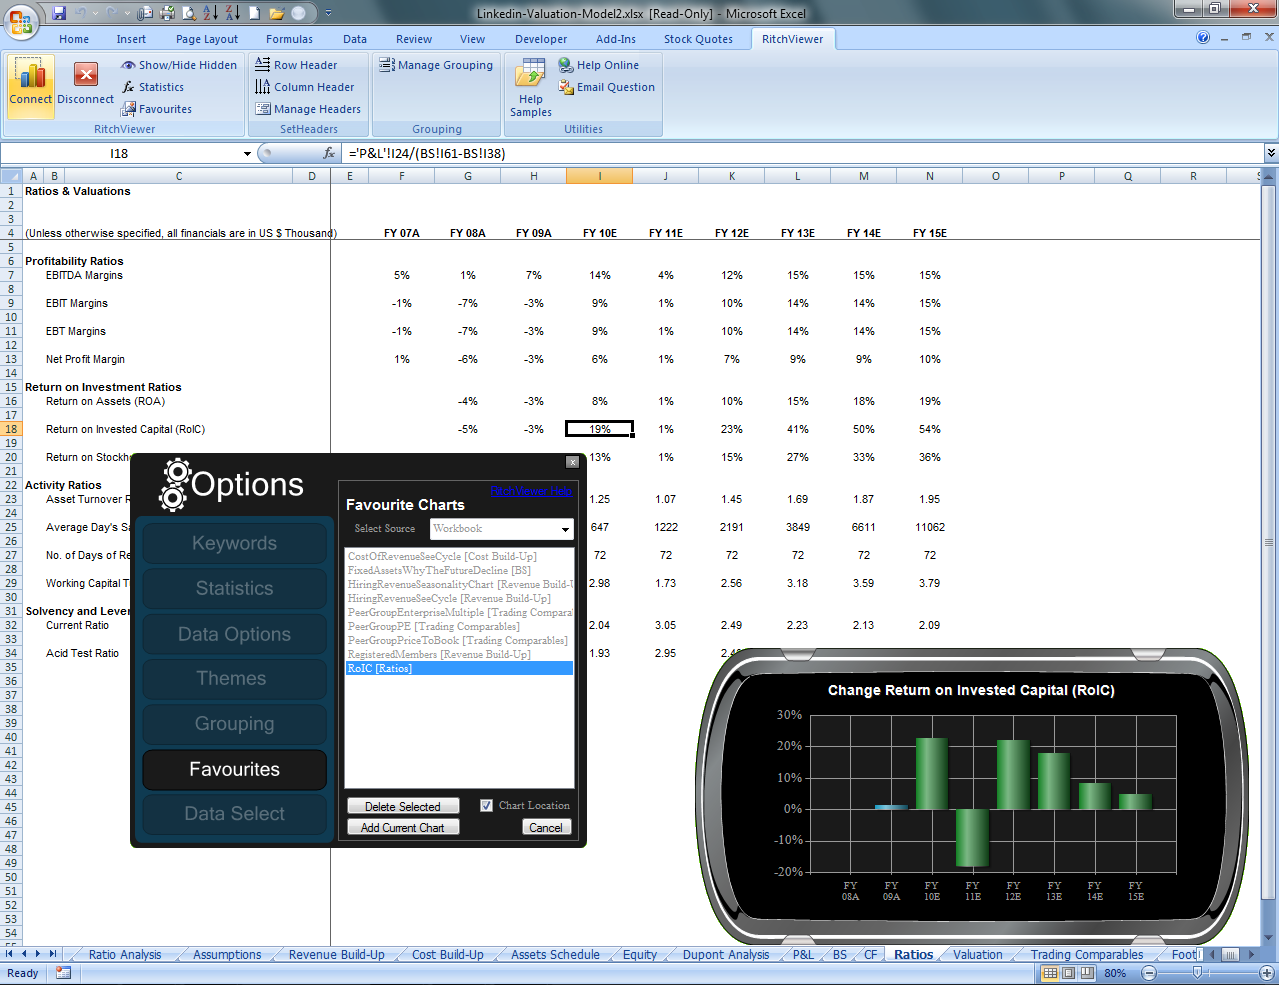
As you move through your workbook looking at data, you might want to earmark certain charts as favourites. Using Favourites allows you to return later and review the same data, or to share what you regard as important aspects of the model with a client or colleague who can also click on each favourite and explore the model.
You can access Favourites:
- from the Microsoft Excel Toolbar using the ‘Favourites’ item; or
- through the RitchViewer© Options menu – move your mouse in the bottom 10% of the RitchViewer© Window and then select ‘Options’.
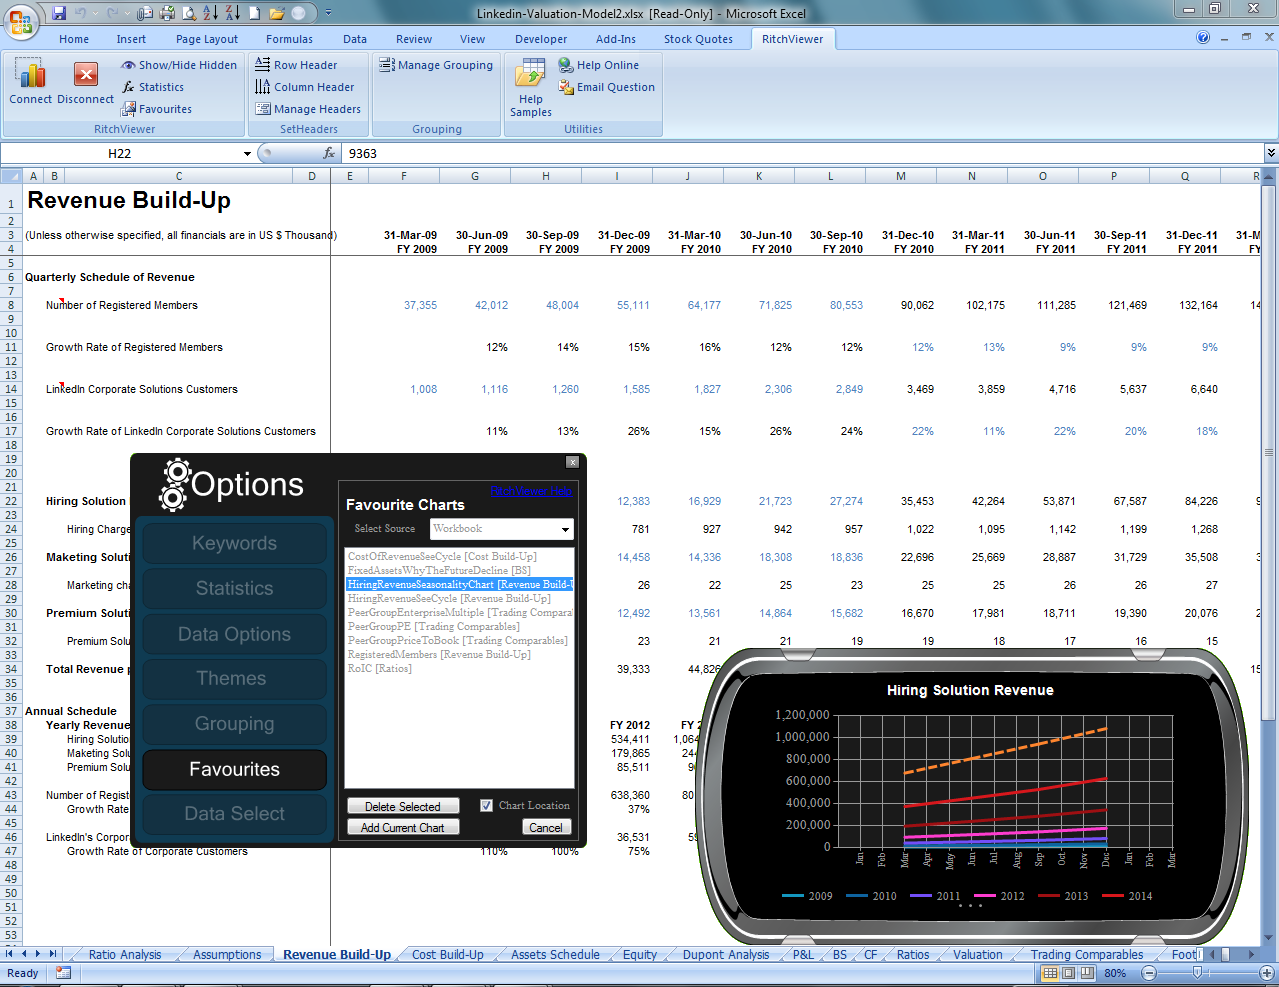
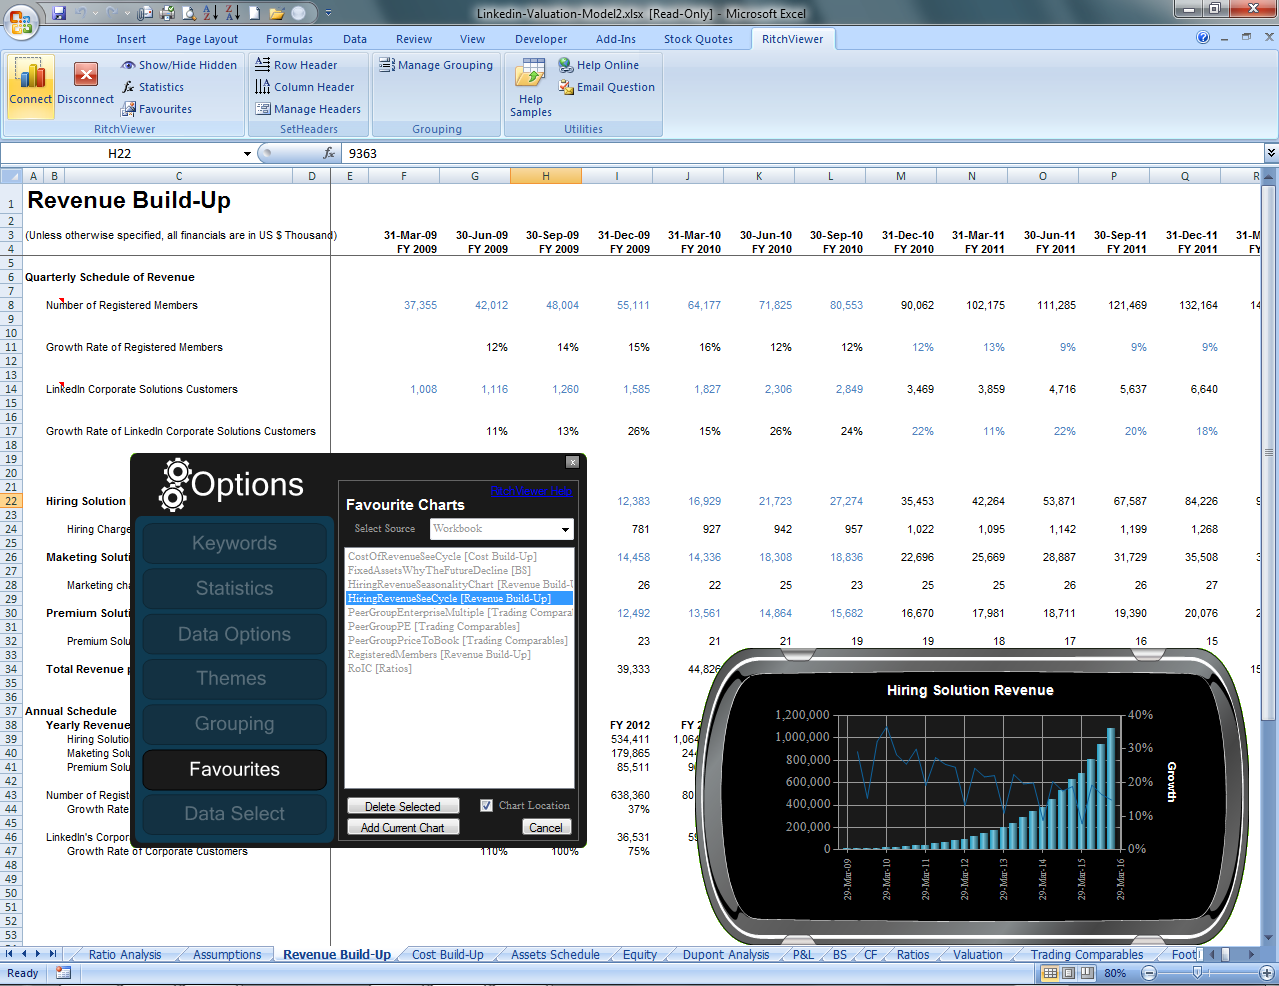
In the following illustration you can see the interaction between Favourites, RitchViewer, and Excel. In this case we have chosen not just to show the favourites, but to be taken to the ‘Chart Location’. This way we get to see the underlying data that accompanies the chart.
How to walk through favourites:
If Favourites has been set previously, then you have two ways to walk through the Favourite charts. You can leave ‘Chart Locations’ unchecked to stay on your current worksheet yet see the chosen charts, or check ‘Chart Locations’ and have the location of the source data appear with the chart animation.
Take a look at the workbooks supplied in the Help Samples installed with RitchViewer©.
How to add favourites
Adding favourites is easy. Just set the chart up over the data you like, and in Favourites press the ‘Add Current Chart’ tab.

Manage Headers
Manage Headers
Understanding Headers & Grouping
When a spreadsheet gets more complex, then you will need to give RitchViewer some simple help describing data boundaries.
Header Basics
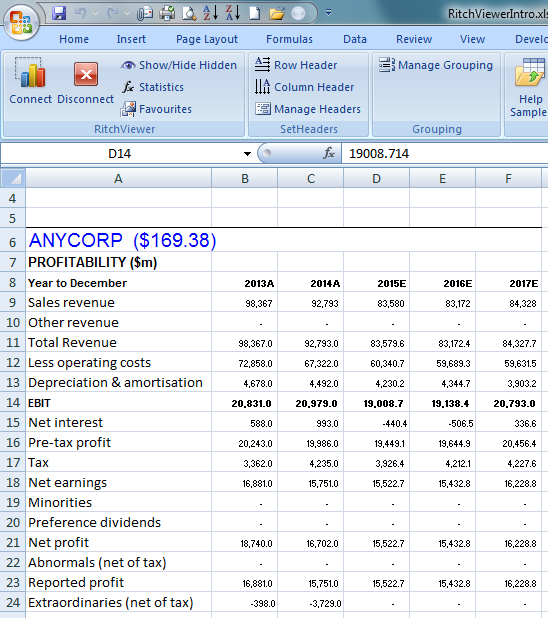
For this sheet we had to tell RitchViewer where the Row Header andColumn Labels were. To do this:
- We selected a point in Row 8 and pressed the Row Header button.
- We selected a point in Column A and pressed the Column Header button.
To examine where RitchViewer is getting its boundaries, click on the cell of interest then press the Manage Headers button.
You can then [Show] the areas used by the chart.
Data Options
Data Options
Lorem ipsum dolor sit amet, consectetur adipiscing elit. Morbi eget sapien sed risus suscipit cursus. Quisque iaculis facilisis lacinia. Mauris euismod pellentesque tellus sit amet mollis. Nulla a scelerisque turpis, in gravida enim. Pellentesque sagittis faucibus elit, nec lobortis augue fringilla sed. Donec aliquam, mi in varius interdum, ante metus facilisis urna, in faucibus erat ex nec lectus. Cras tempus tincidunt purus, eu vehicula ante. Duis cursus vestibulum lorem.
Keyword Groups
Keyword Groups
Lorem ipsum dolor sit amet, consectetur adipiscing elit. Morbi eget sapien sed risus suscipit cursus. Quisque iaculis facilisis lacinia. Mauris euismod pellentesque tellus sit amet mollis. Nulla a scelerisque turpis, in gravida enim. Pellentesque sagittis faucibus elit, nec lobortis augue fringilla sed. Donec aliquam, mi in varius interdum, ante metus facilisis urna, in faucibus erat ex nec lectus. Cras tempus tincidunt purus, eu vehicula ante. Duis cursus vestibulum lorem.

